Electron probe microanalysis facility
The EPMA uses a focused beam of electrons to probe a solid sample, and interactions between the beam and the sample produce electrons, X-rays, and light. Analysis of these phenomena can provide qualitative and quantitative information about the chemical composition of a sample, at a spatial resolution of less than 1 µm (0.001 mm).
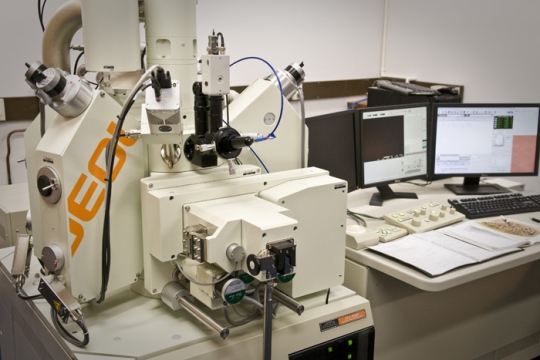
Purchased in 2009, the EPMA is a key instrument in Victoria University of Wellington’s research programmes. The instrument is a highly sensitive system featuring a combination of 5 wavelength dispersive X-ray spectrometers (WDS), a recently developed energy dispersive X-ray spectrometer (EDS) analyser featuring spectral imaging, a JEOL xCLent 3 cathodoluminescence (CL) spectrometer, and highly sensitive detectors for acquisition of backscattered electron (BSE) and secondary electron (SEI) images. Combined with a new PC-based operating environment, these allow the simultaneous collection of light, X-ray and electron signals.
The combined WD/ED system can simultaneously analyse up to 5 WDS elements and all EDS elements, as well as collecting BSE, SEI and CL images.
We are currently implementing a limited semi-commercial service for EPMA analyses. For more information please contact Ian Schipper: ian.vuw.probe@gmail.com
Electron imaging
Secondary electron images
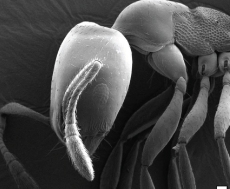
Secondary electron images (SEI) are produced by collecting low energy electrons which are dislodged from the surface of a sample by the incident electron beam. In this mode, the instrument is equivalent to a scanning electron microscope (SEM), and is capable of taking high resolution images at a sub micron scale. For polished surfaces, such as those used for X-ray analysis, these images show relatively little detail. Secondary electron images however are superb for looking at fine scale details in various samples such as materials and microfossils.
Backscattered electron images
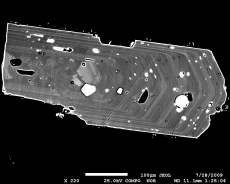
Backscattered electron (BSE) images are produced by counting the number of high energy electrons that are deflected from the surface of the sample. The number of backscattered electrons is related to the mean atomic number under the beam, and BSE images can reveal subtle differences in mineral chemistry, such as crystal zoning. They are also useful in identifying different mineral phases in a sample.
X-ray analysis
The incident electron beam can knock electrons out of orbitals around the nucleus of an atom in the sample and create an electron vacancy. An electron from an outer electron orbital can drop down to fill the space, and the difference in potential energy between the two states is released in the form of an X-ray photon. The difference in energy between orbitals depends on the electronic configuration of the particular atom, and the X-ray photon wavelength is therefore characteristic of the element that produced it.
Wavelength dispersive spectrometers use a crystal monochromator to isolate a particular X-ray wavelength, characteristic of the energy transition of a certain element. By comparing the X-ray intensity of an element in a sample with the intensity in a reference material, the concentration of that element in the sample can be calculated.
In order to access different parts of the X-ray spectrum, several different crystals are required. The JXA-8230 has 5 WDS spectrometers, each with 2 different crystals, giving access to 76 elements from Be to U, excluding the rare gases and radioactive elements. The two new large crystal type spectrometers, give higher detection sensitivity for trace elements.
The EDS detector uses a very sensitive semiconductor detector and separates elements on the basis of X-ray energies rather than wavelength (although these are related). The EDS can detect the whole X-ray energy spectrum at once and used to rapidly identify the elements present in a sample. EDS is not as sensitive as WDS, but these X-ray analysis techniques are complementary.
Cathodoluminescence
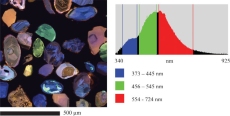
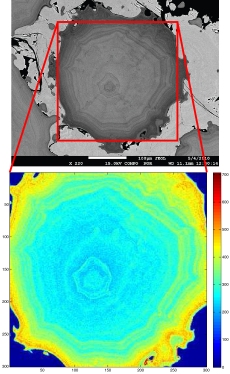
Cathodoluminescence (CL) refers to infrared, visible and ultraviolet light that is produced when an electron beam interacts with a sample. The intensity of CL depends on the crystal’s properties, including the presence of trace amounts of certain CL activating elements (usually transition metals and rare earth elements) and the structure of the crystal lattice, including any defects.
CL can be used to identify trace element zones in samples such as zircons, even where the differences may be too subtle to be observed with X-rays. Microtextures and overgrowths are readily observed even if compositional differences are very small.
Applications
The EPMA has a wide variety of applications. Some areas of active research include:
- Volcanology – estimating residence times of magma bodies under a volcano prior to eruption.
- Supervolcanoes – understanding the mechanics of supervolcano eruptions and their generation. Some of the largest known supervolcano eruptions in the world occurred in New Zealand.
- Tephra analysis and fingerprinting – glass deposited from a volcanic eruption can be identified from its chemical composition. Sediments can be dated in this way.
- Geothermometry and geobarometry – temperatures and pressures of rock formation can be derived from the analysis of minerals it contains.
- Meteorites – major element chemistry of mineral phases in meteorites, which combined with trace elements and isotopes, are used in understanding processes in the early solar system.
- Paleoclimate – SEM imaging and element distributions in microfossils that are used in paleoclimate studies.